The First Insurance Co., Ltd.
Home
Contact Us
Chinese
About First
Our Logo
First Ins.
Business Review
Operating Report
Business Plans
Financial Report
Balance Sheet
Income Statement
Annual financial report
Interim financial report
Organization
Chart
Management
Main Services
Fire
Marine
Motor
Machinery and Engineering
Liability
Performance Bond Insurance
Credit Insurance
Aviation Insurance
Others
Personal Accident
Health Insurance
Reinsurance
Damage Prevention Services
Service Sites
Head Office
Taipei Branch Office
Taochu Branch Office
Taichung Branch Office
Tainan Branch Office
Kaohsiung Branch Office
Corporate Governance
2023~2025 Statement of Operating Revenue
2024 Annual Report
2024 Operational Overview
2025 Meeting Manual
2024 ESG Report(EN)
Top 10 shareholders of the Company
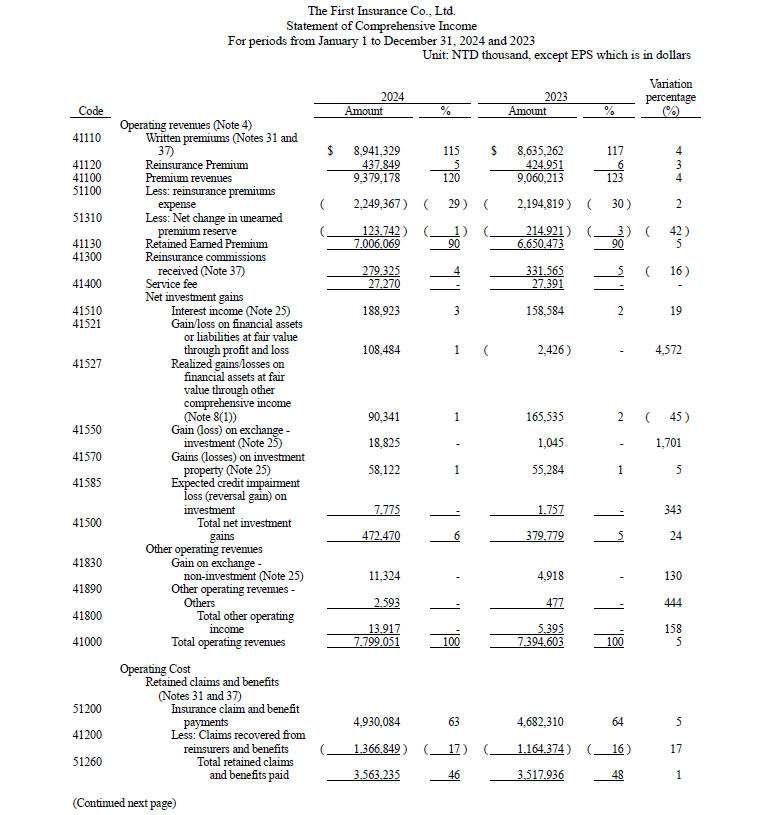
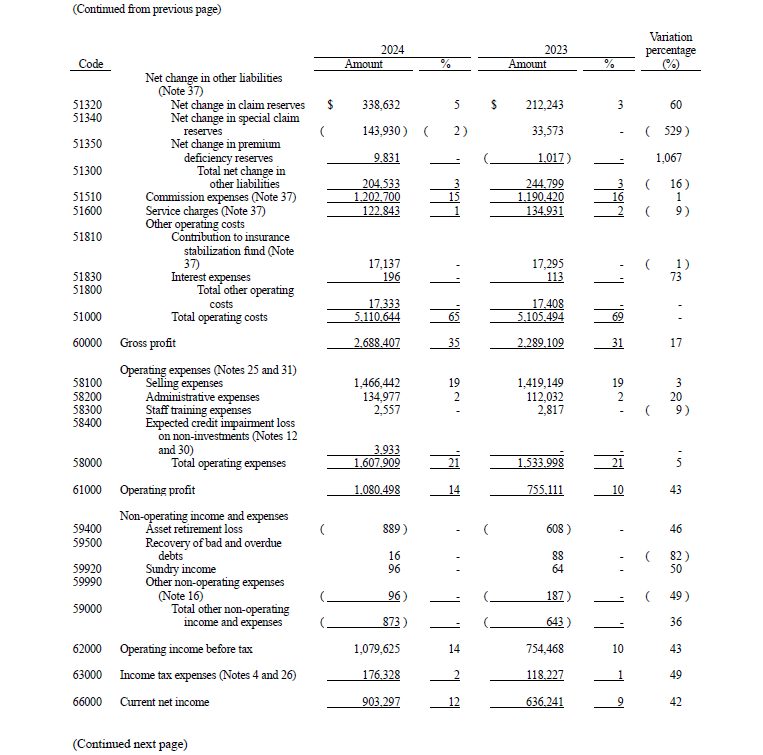
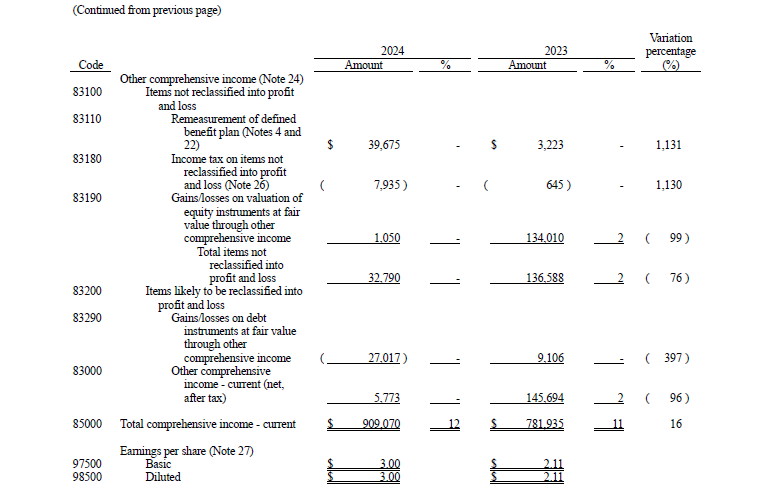
COMPREHENSIVE INCOME STATEMENT
For periods from January 1 to December 31, 2024 and 2023